🌋 Hawaii Volcano Watch
WATCHNear real-time updates from the USGS Hawaiian Volcano Observatory — For informational & educational purposes only
Source: USGS Kīlauea Volcano — All data from USGS/HVO. Not affiliated with USGS.
🚨 Volcano Status
Episode 43 Forecast
March 5 – 15
🌋 ~12 days until eruption
Heightened or escalating unrest with increased potential of eruption, or eruption underway with limited hazards.
Heightened unrest with increased likelihood of eruption, or eruption underway with minor ash emissions.
USGS update: Saturday, February 21, 2026, 8:19 AM HST
📋 Activity Summary
- •Alert level is WATCH, aviation color code is ORANGE.
- •The Halemaʻumaʻu eruption of Kīlauea is paused.
- •Episode 42 ended February 15 at 11:38 p.m.
- •Preliminary models suggest the likely forecast window for the onset of episode 43 lava fountaining is March 5-15.No significant activity has been noted along Kīlauea’s East Rift Zone or Southwest Rift Zone.A recap of episode 42 can be found in this Status Report.Significant changes in activity between Daily Updates are posted here: https://www.usgs.gov/observatories/hvo/observatory-messages.
- •The initial rapid rebound of tilt and glow from both vents indicate that another fountaining episode is likely.
- •Preliminary models suggest the forecast window for the start of episode 43 fountaining is likely between March 5 and March 15.
Full USGS analysis
The initial rapid rebound of tilt and glow from both vents indicate that another fountaining episode is likely. The inflationary trend over the past several days has been interrupted by significant periods of slight deflation that may impact the onset of episode 43 fountaining. Deflation has not been common in the early stages of repose between fountaining episodes, and it is uncertain how it might impact the ability to model the onset of episode 43. Preliminary models suggest the forecast window for the start of episode 43 fountaining is likely between March 5 and March 15. Additional data are needed to more accurately determine the forecast window.Kīlauea has been erupting episodically since December 23, 2024, primarily from two vents (north and south) in Halema‘uma‘u. Eruptive episodes, which generally last for less than 12 hours, are separated by pauses that can be as long as over two weeks.HVO continues to closely monitor Kīlauea and is in contact with Hawai‘i Volcanoes National Park and the Hawai‘i County Civil Defense Agency about eruptive hazards.Please see the Hawaiʻi Volcanoes National Park website for visitor information: https://www.nps.gov/havo/index.htm
📐 Summit Tilt — Past 3 Months
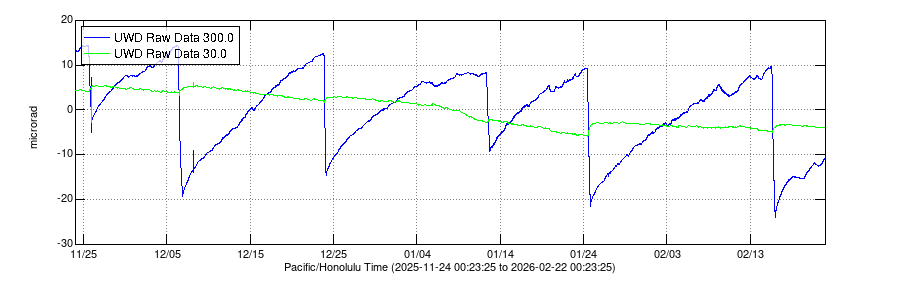
What is tilt? Electronic tiltmeters measure tiny changes in the slope of the ground near the volcano's summit. Think of it like a very sensitive carpenter's level.
Why it matters: When magma moves into the reservoir beneath the summit, the ground inflates (tilts upward). Rapid inflation often precedes eruption episodes. Deflation during eruption shows magma leaving the reservoir. The pattern of inflation → eruption → deflation repeats with each fountaining episode.
Source: USGS Monitoring Data
📷 Summit Webcam
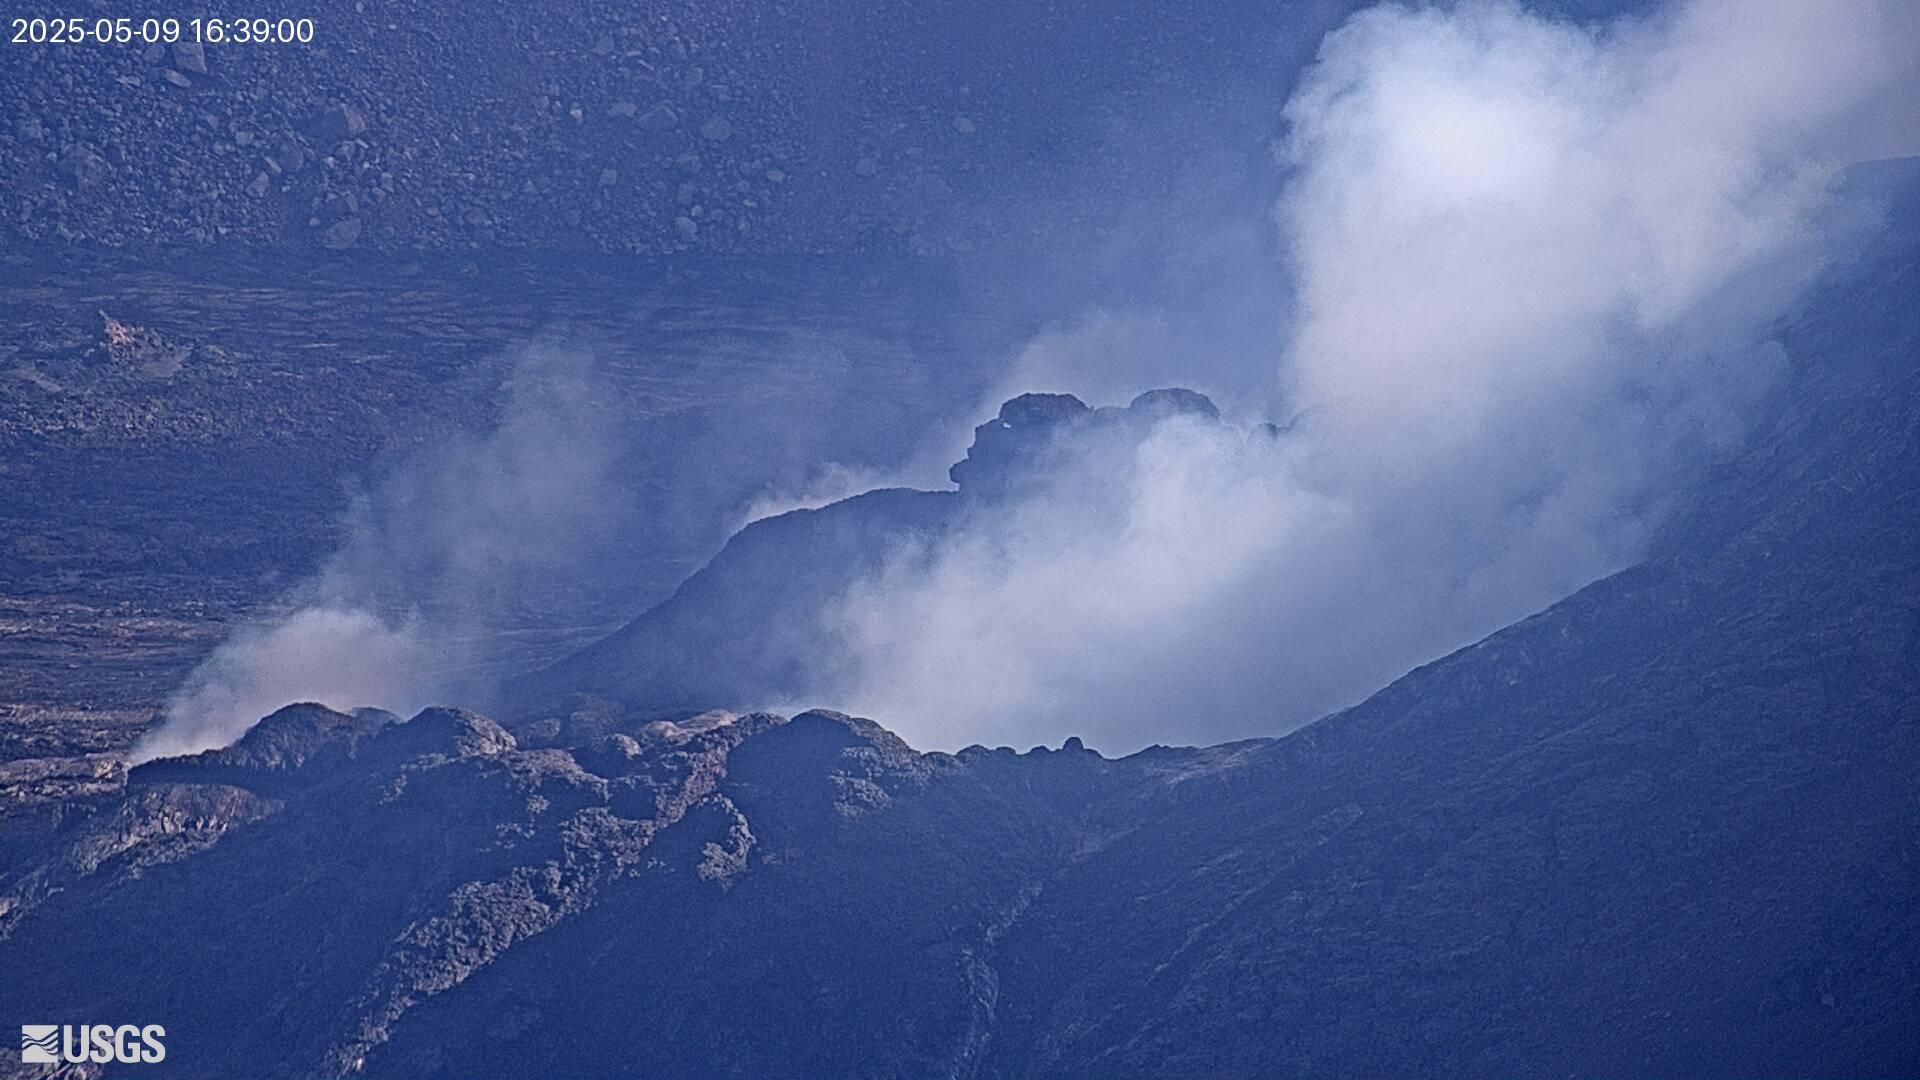
V1cam — West Halemaʻumaʻu crater. Image refreshes periodically at source.
Source: USGS Webcams
📷 View all live webcams →📊 Timeline of Eruptive Episodes
| # | Start (HST) | Pause (HST) | Duration | Pause After | Height (m) | Vol (Mm³) |
|---|---|---|---|---|---|---|
| 42 | February 15, 2026 - 1:50 p.m. | February 15, 2026 - 11:38 p.m. | 10 hours | TBD | 400 (may update) | 11.6 |
| 41 | January 24, 2026 - 11:10 a.m. | January 24, 2026 - 7:29 p.m. | 8 hours | 22 days | 450 | 10.6 |
| 40 | January 12, 2026 - 8:22 a.m. | January 12, 2026 - 6:04 p.m. | 10 hours | 12 days | 250 | 5.5 |
| 39 | December 23, 2025 - 8:10 p.m. | December 24, 2025 - 2:13 a.m. | 6 hours | 19 days | 407 | 9.3 |
| 38 | December 6, 2025 - 8:45 a.m. | December 6, 2025 - 8:52 p.m. | 12 hours | 17 days | 384 | 12.1 |
| 37 | November 25, 2025 - 2:30 p.m. | November 25, 2025 - 11:39 p.m. | 9 hours | 10 days | 174 | 6.0 |
| 36 | November 9, 2025 - 11:15 a.m. | November 9, 2025 - 4:16 p.m. | 5 hours | 16 days | 386 | 8.1 |
| 35 | October 17, 2025 - 8:05 p.m. | October 18, 2025 - 3:32 a.m. | 7 hours | 22 days | 479 | 10.2 |
| 34 | October 1, 2025 - 12:53 a.m. | October 1, 2025 - 7:03 a.m. | 6 hours | 17 days | 383 | 9.0 |
| 33 | September 19, 2025 - 3:11 a.m. | September 19, 2025 - 12:08 p.m. | 9 hours | 12 days | 249 | 5.7 |
| 32 | September 2, 2025 - 6:35 a.m. | September 2, 2025 - 8:01 p.m. | 12 hours | 16 days | 101 | 9.0 |
| 31 | August 22, 2025 - 2:04 p.m. | August 23, 2025 - 2:52 a.m. | 13 hours | 10 days | 88 | 7.6 |
| 30 | August 6, 2025 - 1:20 a.m. | August 6, 2025 - 12:55 p.m. | 12 hours | 16 days | 52 | 7.9 |
| 29 | July 20, 2025 - 5:15 a.m. | July 20 - 6:35 p.m. | 13 hours | 16 days | 63 | 6.7 |
| 28 | July 9, 2025 - 4:10 a.m. | July 9 - 1:20 p.m. | 9 hours | 11 days | 321 | 5.2 |
| 27 | June 29, 2025 - 9:05 a.m. | June 29, 2025 - 7:54 p.m. | 11 hours | 8 days | 332 | 5.9 |
| 26 | June 20, 2025 - 1:40 a.m. | June 20, 2025 - 10:25 a.m. | 9 hours | 9 days | 371 | 6.6 |
| 25 | June 11, 2025 - 11:57 a.m. | June 11, 2025 - 8:08 p.m. | 8 hours | 8 days | 350 | 5.3 |
| 24 | June 4, 2025 - 8:55 p.m. | June 5, 2025 - 4:28 a.m. | 7.5 hours | 6 days | 364 | 5.0 |
| 23 | May 25, 2025 - 4:15 p.m. | May 25, 2025 - 10:25 p.m. | 6 hours | 10 days | 345 | 4.6 |
| 22 | May 16, 2025 - 5:13 a.m. | May 16, 2025 - 3:29 p.m. | 10 hours | 9 days | 276 | 3.6 |
| 21 | May 11, 2025 - 12:45 p.m. | May 11, 2025 - 8:36 p.m. | 8 hours | 4 days | 217 | 3.1 |
| 20 | May 6, 2025 - 5:28 p.m. | May 6, 2025 - 9:28 p.m. | 4 hours | 5 days | 153 | 2.4 |
| 19 | May 1, 2025 - 9:28 p.m. | May 2, 2025 - 5:20 a.m. | 8 hours | 5 days | 126 | 2.8 |
| 18 | April 22, 2025 - 3:30 a.m. | April 22, 2025 - 1:28 p.m. | 10 hours | 9 days | 266 | 5.2 |
| 17 | April 7, 2025 - 10:15 p.m. | April 9, 2025 - 9:45 a.m. | 35.5 hours | 13 days | 73 | 3.9 |
| 16 | March 31, 2025 - 10:57 p.m. | April 2, 2025 - 12:04 p.m. | 37 hours | 5 days | 326 | 6.0 |
| 15 | March 25, 2025 - 12:04 p.m. | March 26, 2025 - 7:10 p.m. | 31 hours | 5 days | 322 | 3.6 |
| 14 | March 19, 2025 - 9:26 a.m. | March 20, 2025 - 1:49 p.m. | 28 hours | 5 days | 225 | 2.4 |
| 13 | March 11, 2025 - 2:36 a.m. | March 11, 2025 - 3:13 p.m. | 13 hours | 8 days | 215 | 5.5 |
| 12 | March 4, 2025 - 7:30 a.m. | March 5, 2025 - 10:37 a.m. | 27 hours | 6 days | 176 | 4.4 |
| 11 | February 25, 2025 - 6:26 p.m. | February 26, 2025 - 7:06 a.m. | 13 hours | 6 days | 157 | 4.0 |
| 10 | February 19, 2025 - 8:22 p.m. | February 20, 2025 - 9:18 a.m. | 13 hours | 5 days | 146 | 2.5 |
| 9 | February 11, 2025 - 10:16 a.m. | February 12, 2025 - 8:43 a.m. | 22 hours | 7 days | 135 | 5.2 |
| 8 | February 3, 2025 - 9:52 p.m. | February 4, 2025 - 7:23 p.m. | 22 hours | 7 days | 114 | 4.6 |
| 7 | January 27, 2025 - 6:41 p.m. | January 28, 2025 - 10:41 a.m. | 16 hours | 6 days | 89 | 2.9 |
| 6 | January 24, 2025 - 11:28 p.m. | January 25, 2025 - 12:36 p.m. | 13 hours | 2 days | 70 | 1.1 |
| 5 | January 22, 2025 - 2:30 p.m. | January 23, 2025 - 4:30 a.m. | 14 hours | 2 days | 41 | 1.0 |
| 4 | January 15, 2025 - 9 a.m. | January 18, 2025 - 10:10 a.m. | 3 days | 4 days | 95 | 6.5 |
| 3 | December 26, 2024 - 8 a.m. | January 3, 2025 - 8:30 p.m. | 8.5 days | 12 days | 86 | 13.0 |
| 2 | December 24, 2024 - 8 a.m. | December 25, 2024 - 11 a.m. | 27 hours | 21 hours | 95 | 4.7 |
| 1 | December 23, 2024 - 2:20 a.m. | December 23, 2024 - 4 p.m. | 14 hours | 16 hours | 158 | 9.3 |
Source: USGS Eruption Information — All times HST. Data preliminary and subject to revision.
🗺️ Best Viewing Area
Lava can be seen at numbered areas listed below. Park at designated overlooks and parking areas for the best views of the eruption.

Source: Hawaiʻi Volcanoes National Park